PowerBI Supplier Spend Dashboard – Aggregate Data From Folder of Multiple Excel Files
The Problem: A need for a solution to gain high level visibility of categorized quarterly spend to manage suppliers more effectively. Make informed decisions by analyzing spend, improving sourcing efficiencies, and increasing savings.
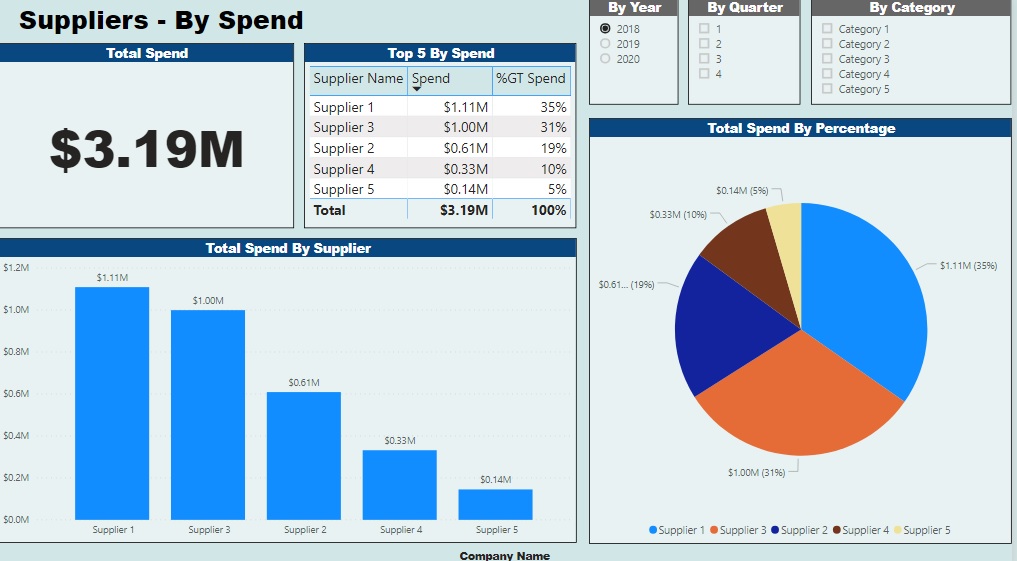
The Solution: Let’s reconcile spend in an interactive PowerBI dashboard that aggregates categorized company spend provided by the supplier. Suppliers fill out a template, it goes into a secure repository, and then the PowerBI dashboard is “Refreshed” to reflect the newly added data.
Why PowerBI over Tableau? The answer is FREE.
How It Works: A secure web portal would be the most effective solution to request quarterly spend from suppliers, but that will cost more and take longer to setup. Instead, each supplier will fill out a predefined template in Microsoft Excel and send it back. It will go into a secure repository and a “Power Query” in PowerBI can be setup to aggregate the files, transform, and load the data into a visualization. The ability to visualize the data by year, quarter, category, top suppliers, etc. is now possible. Redundant Powerpoint decks can take a backseat as we now have a dynamic, uniform, data driven visualization that will update almost immediately.
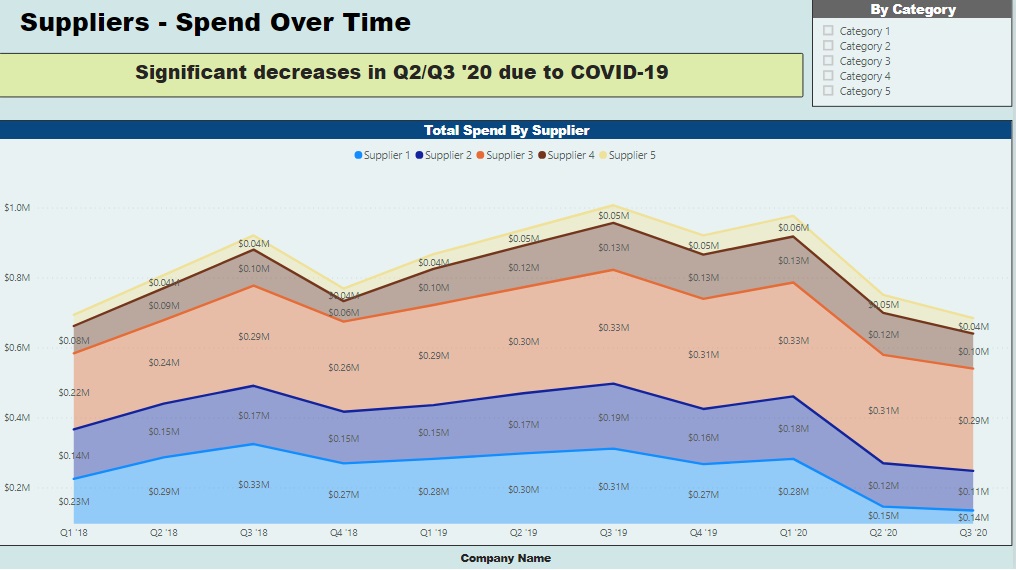
Below is a .zip file containing the excel template for suppliers to fill out, “received files” as data that I made up (notice the COVID-19 downward trend), and the PowerBI dashboard.
Extract the files to a folder of your choice. Files can be added (or edited) in the “Received Spend Files” folder. Make sure the supplier name is correct in the first parenthesis and the 4 digit year and quarter are in the second parenthesis. The filename needs to be named as follows…
Template – (Supplier 1) Quarterly Spend Request (2018Q1)
You will need to change the data source of the dashboard to point to the new folder location of the excel files (on your computer).
Open the “Supplier Spend.pbix” PowerBI dashboard and click the downward arrow at the bottom right of “Edit Queries”.
Click “Data Source Settings” on the popup menu.
Click “Change Source…” and then click “Browse” to select the location of the “Received Spend Files” folder.
Click “Close”.
You will see a yellow popup “There are pending changes in your queries that haven’t been applied.” Click “Apply Changes”.
The data source has been pointed to the location on your computer and now you are free to edit, add, or remove Excel files in the “Received Spend Files” folder.
Click “Refresh” in PowerBI to reflect the changes to the folder.
Good Things To Know: Only Excel files can live in the “Received Spend Files” folder. The dashboard has to be outside of that folder. File names are very important! PowerBI is free until you want to publish the dashboard for other members of the team (if the data is critical, keep it local and present from your laptop or export to pdf for your team). You can use the Power Query in Excel to aggregate, transform, and load the data minus the cool visualizations that PowerBI offers.
About Me

A self-taught front end web developer who loves to travel, create things, solve problems, and grill! I enjoy the challenge of taking things apart, learning how they work, and improving them. I created this site to document and share what I've learned.